Google Analytics is a powerful tool that allows businesses to track and analyze website traffic, providing insights into user behavior, traffic sources, and marketing campaign effectiveness. By understanding user interactions, businesses can optimize their marketing strategies. This article will explore how to track QR codes with Google Analytics to provide valuable insights into user engagement and marketing success.
View also: Track QR Code Scans
Part 1: Can Google Analytics Track QR Codes?
Yes, Google Analytics can track QR codes. You can add UTM parameters to your content, which will then be converted into a QR code. Google Analytics can then monitor the performance of the QR code in terms of user engagement, conversions, and other metrics. Read on to learn how to use Google Analytics QR code tracking.
Part 2: How to Track QR Codes with Google Analytics
Step 1. Add UTM parameters to your link
Step 2. Convert the link to a QR code
Step 3. View the QR code data
Step 1. Add UTM Parameters to Your Link
To effectively track QR codes with Google Analytics, you need to append UTM parameters to the URL that the QR code will direct users to. Here's how:
1. Select your URL: Start with the URL you want users to visit after scanning your QR code.
2. Use a UTM Builder: Utilize a UTM parameter builder tool, such as Google's Campaign URL Builder. This tool helps you create custom URLs with UTM parameters.
3. Fill in the required fields: Enter your destination URL and add the required UTM parameters.
Campaign Source: Specify where the traffic is coming from (e.g., "QR_Code").
Campaign Medium: Indicate the medium (e.g., "Advertisement").
Campaign Name: Name your campaign for easy identification (e.g., "Summer_Sale").
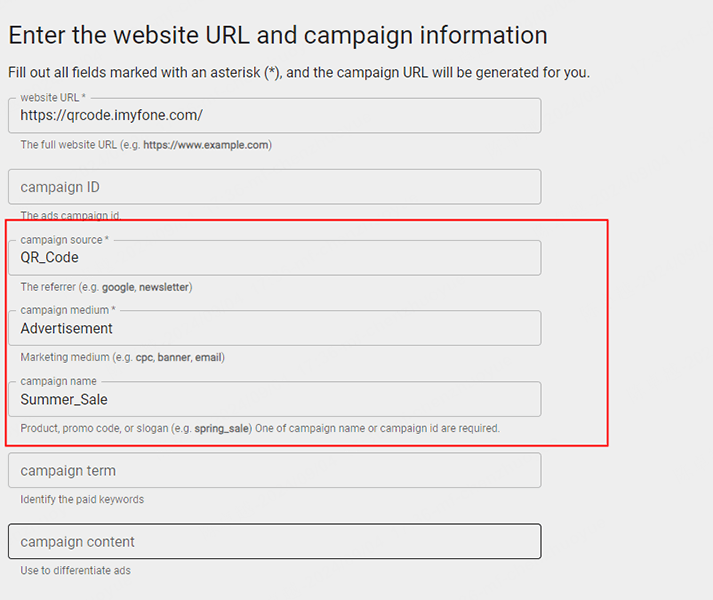
4. Generate URL: Once you've filled in the fields, the tool will generate a new URL with UTM parameters.
5. Shorten the URL: Click the orange button to shorten the URL.
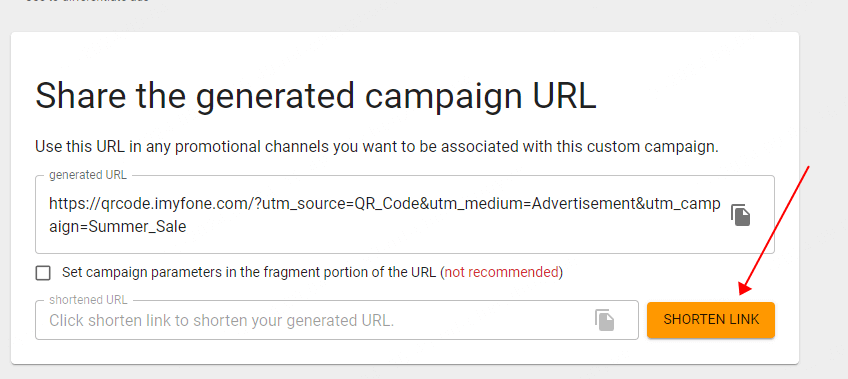
The URL with UTM parameters added is long, and if you convert it directly to a QR code, the black square in the QR code will be small and crowded. This may make it difficult to scan. Therefore, it is best to shorten the URL.
Step 2. Convert the Link to a QR Code
Now that you have a shortened URL with UTM parameters, it's time to create a QR code that users can scan. We recommend using a QR code generator that can track QR code scan data in real time, such as iMyFone QRShow. It can track when the QR code was scanned, from where, on which operating system, and more.
1. Go to QRShow's dashboard by clicking the button below and sign in to your free account.
2. Click Create QR Code and then choose Website. Then paste the shortened URL you created.
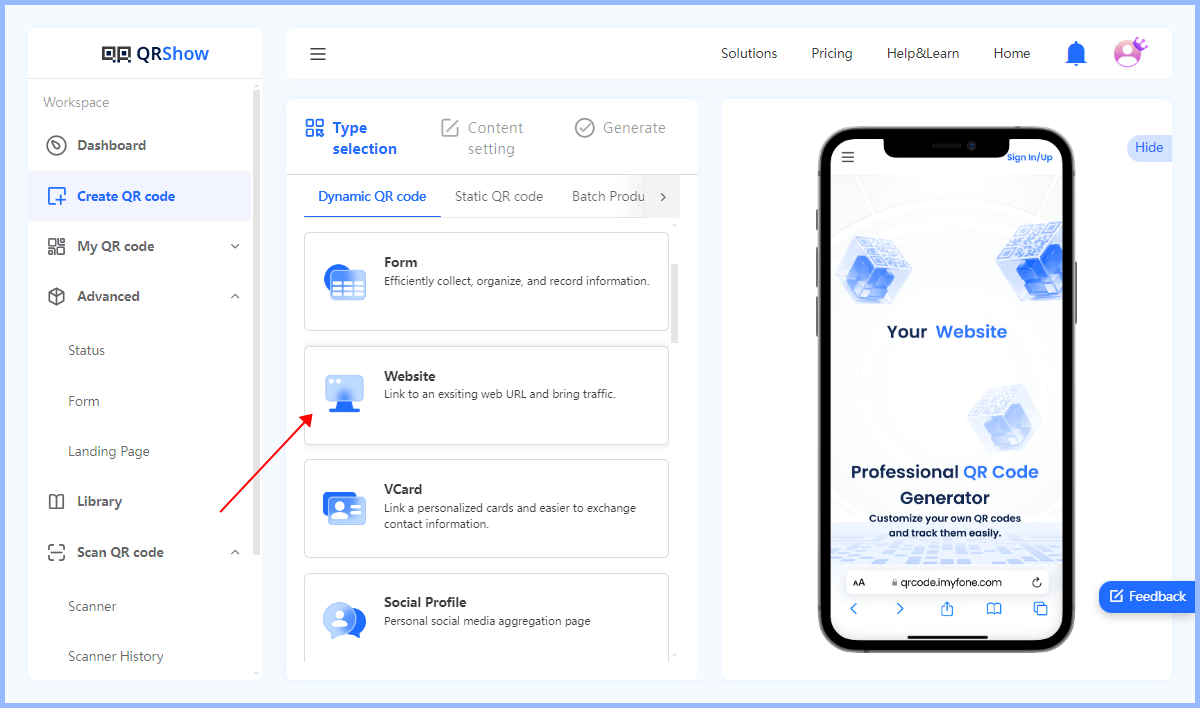
3. Customize the QR code (optional): You can change the QR code color, add a logo, adjust the shape, etc.
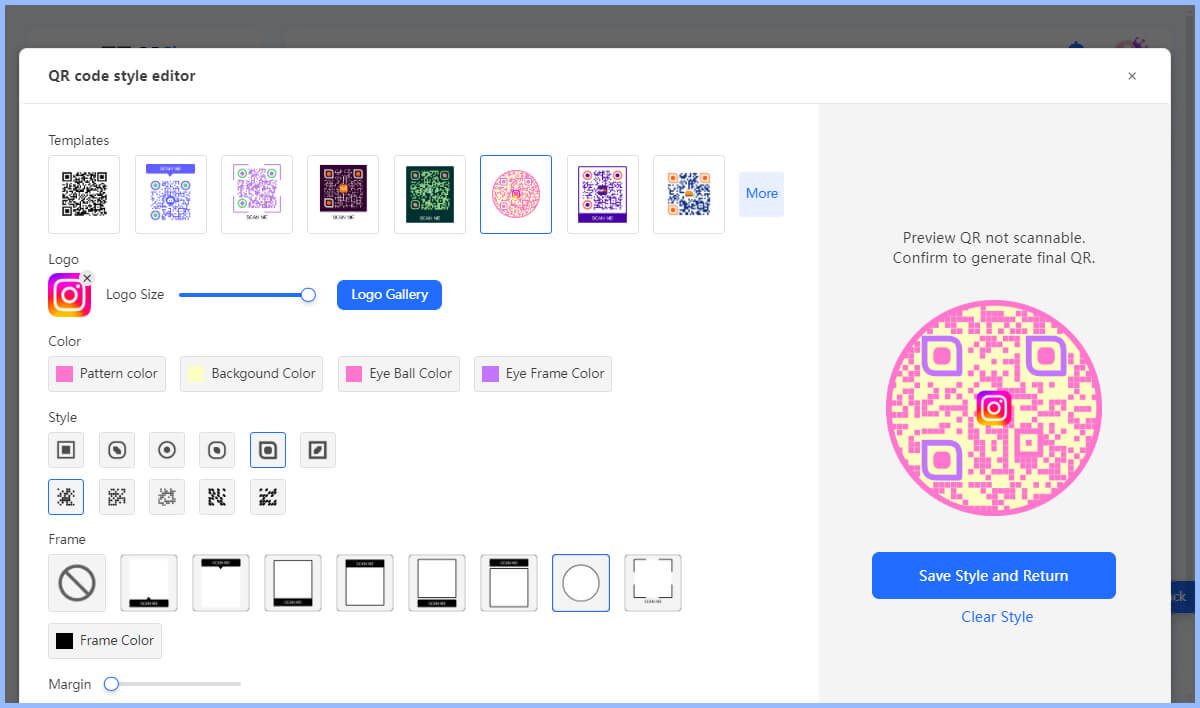
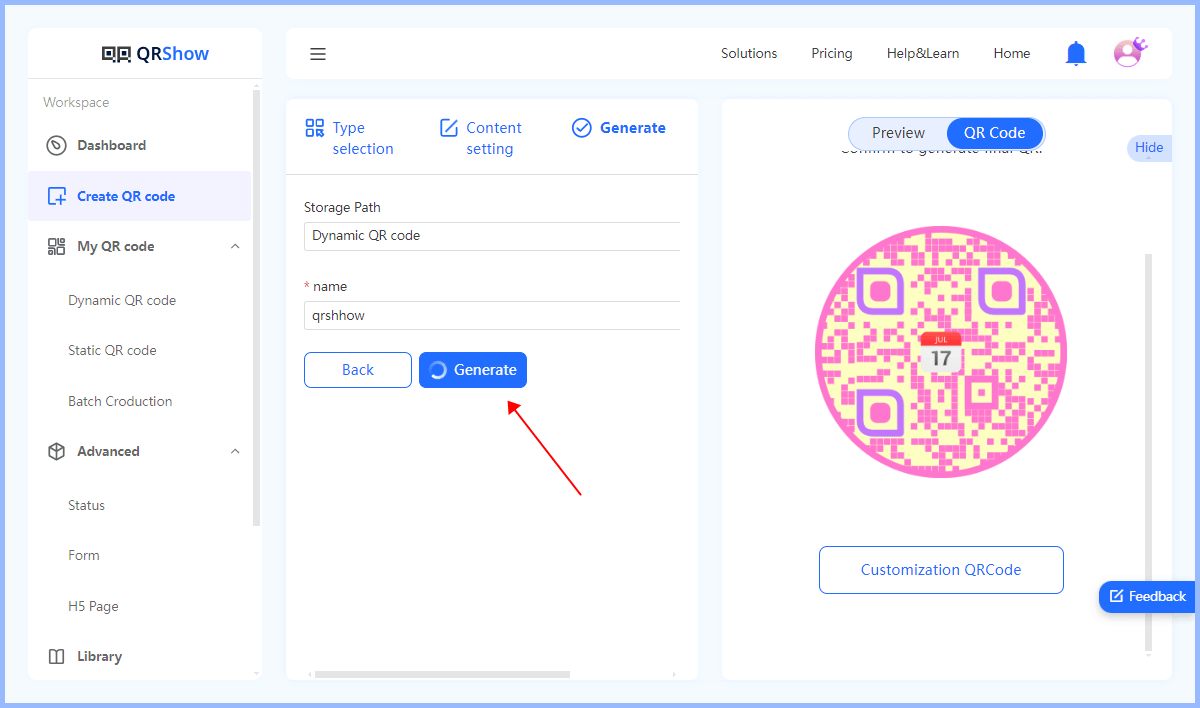
4. Click the Generate button to create the QR code with UTM parameters.
5. Before using the QR code, scan the QR code with a smartphone to make sure it directs users to the correct URL.
- Customizable QR codes include colors, logos, templates, and more.
- Update destination URLs or content without generating new codes.
- Monitor scans in real time and analyze geography, device type, scan time, and more.
- Easy to use, user security, and data privacy included.
Step 3. View the QR Code Data
Once you have set up your QR Code campaign and are tracking relevant metrics, you can easily view the data in Google Analytics. Follow these steps to access your QR Code data:
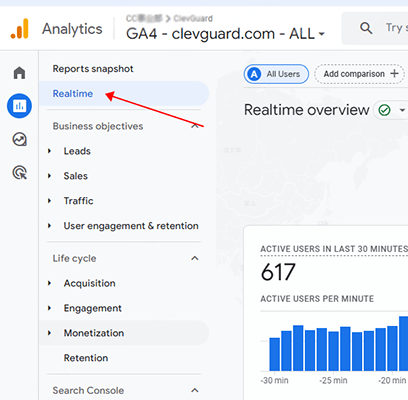
1. Log in to Google Analytics.
2. Click Reports > Realtime > Event count by Event Name > page_view.
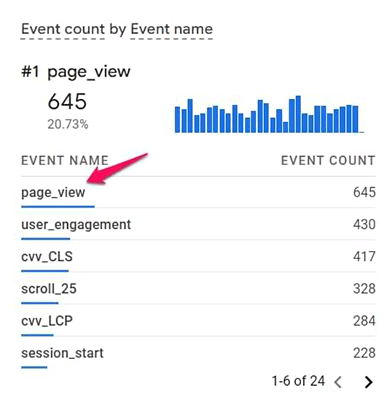
You can then view the following data based on the utm parameters you have set:
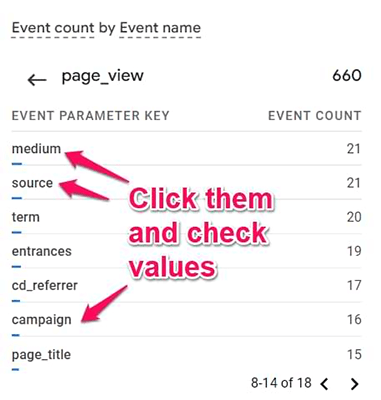
campaign (represents the value of utm_campaign, which identifies the campaign name)
medium (represents utm_medium, which tells you how they got here)
source (represents utm_source, which identifies the source of traffic)
3. Navigate to Reports > Acquisition > Traffic Acquisition.
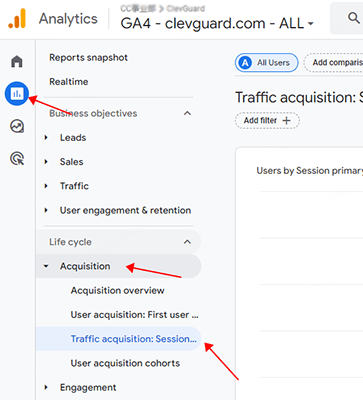
After that, you need to switch the primary dimension to Session Medium to see data related to the QR code.
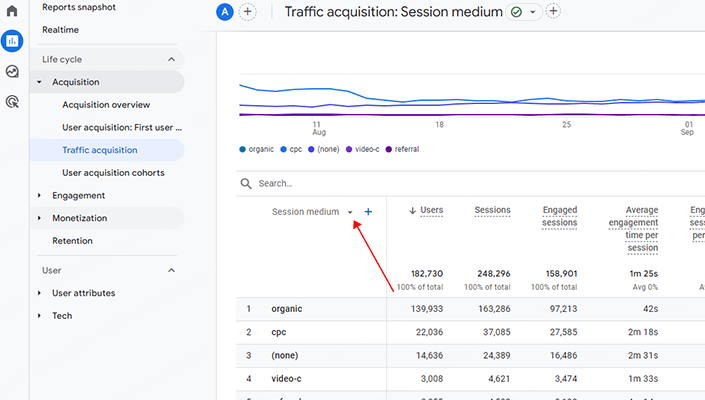
You can also add the secondary dimension Session Source by clicking the plus icon. This allows you to see how many sessions, users, conversion page views, average session duration, bounce rate, conversion rate, etc. you got from visitors who scanned the QR code.
Part 3: What QR Code Metrics Can You Track in Google Analytics
Once you've set up your QR code with UTM parameters and started directing traffic to your website, you can track a variety of metrics in Google Analytics. Here are the key QR code metrics you can track:
- Total number of times the QR code was scanned
- Number of unique devices that scanned the QR code
- Geographic location of where the scan occurred
- Device that scanned the QR code (mobile, desktop, tablet)
- Operating system used by the scanning device (Android, iOS, Mac, Windows)
- Session duration
- Bounce rate
- Average number of pages viewed per session
- Conversions
- Total revenue generated from QR code scans
- Native language used by the user
- Country of residence
- City/specific location
- User age
- User gender
- Ensure there is enough contrast between
- QR Code foreground andbackground Use high-quality logos and images
- Test print quality
Conclusion
That's all about how to track QR codes with Google Analytics. Tracking QR code campaigns with Google Analytics can provide valuable insights into user engagement and the effectiveness of your marketing initiatives. By implementing UTM parameters, you can accurately monitor the traffic generated by your QR codes and analyze key performance indicators.


Rated Successfully!
You have already rated this article!